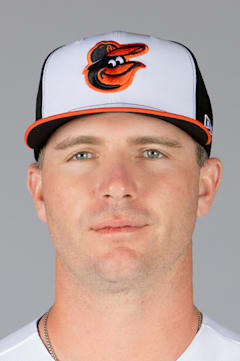
Pete Alonso
Alonso's power surge has stalled dramatically since his record-breaking rookie campaign. After crushing 53 home runs in 2019 — the most by any first-year player in history — he's averaged just 30 homers per season over the past six years. His .253 career average tells the story of a slugger who trades contact for power, but the power output no longer justifies the holes in his swing.
The concerning trend is his inability to recapture that rookie magic. His 124 OPS+ in 2019 remains his career high, and he hasn't cracked 40 home runs since. At 32, Alonso faces the reality that his peak may have been that electrifying debut season when he seemed destined to challenge home run records.
Five All-Star selections show he's remained productive, but his 117 career OPS+ suggests he's been merely above-average rather than elite. The question heading into 2026 is whether this former Rookie of the Year can find one more gear or if he's settling into veteran mediocrity.
| Date | AB | H | HR | RBI | BB | SO | AVG |
|---|---|---|---|---|---|---|---|
| Jul 12 | 5 | 1 | 0 | 1 | 0 | 2 | .252 |
| Jul 11 | 4 | 2 | 1 | 2 | 0 | 2 | .253 |
| Jul 10 | 3 | 1 | 0 | 0 | 1 | 2 | .250 |
| Jul 9 | 1 | 0 | 0 | 0 | 2 | 1 | .249 |
| Jul 8 | 5 | 1 | 1 | 2 | 0 | 0 | .250 |
| Jul 7 | 4 | 1 | 0 | 0 | 0 | 1 | .251 |
| Jul 5 | 4 | 0 | 0 | 0 | 0 | 1 | .251 |
| Jul 4 | 3 | 3 | 0 | 1 | 2 | 0 | .254 |
| Jul 3 | 4 | 1 | 0 | 0 | 0 | 1 | .247 |
| Jul 1 | 3 | 0 | 0 | 0 | 1 | 2 | .247 |
Career · Batting
8 seasons| Year | Team | G | AB | HR | RBI | AVG | OPS | OPS+ |
|---|---|---|---|---|---|---|---|---|
| 2019 | — | 161 | 597 | 53 | 120 | — | — | — |
| 2020 | — | 57 | 208 | 16 | 35 | — | — | — |
| 2021 | — | 152 | 561 | 37 | 94 | — | — | — |
| 2022 | — | 160 | 597 | 40 | 131 | — | — | — |
| 2023 | — | 154 | 568 | 46 | 118 | — | — | — |
| 2024 | — | 162 | 608 | 34 | 88 | — | — | — |
| 2025 | — | 162 | 624 | 38 | 126 | — | — | — |
| 2026 | — | 98 | 364 | 21 | 66 | — | — | — |
| Career | 1106 | 4127 | 285 | 778 | — | — | — | |
Every ball this hitter has put in play — how hard it left the bat, and at what angle. The red field behind the dots shows how much damage that kind of contact does, league-wide: the darker the red, the better things go for the hitter.
The field — league-average xwOBA (what a batted ball is typically worth: 0.0 is a sure out, ~2.0 a sure home run) for every exit-velocity × launch-angle combination, measured from 1.3 million regular-season balls in play since 2015. The dark ridge — balls hit 105+ mph at 25–30° — is the barrel zone, where contact becomes near-automatic extra bases.
The dots — this hitter’s career regular-season balls in play, grouped to a fine grid; a bigger dot means more batted balls at that exact combination. Dots piled onto the red ridge are damage; dots low on the pale field are weak or mishit contact. Spring training and the postseason are excluded.
Matchups, projections, comps — grounded in Lahman, Retrosheet, and Statcast.