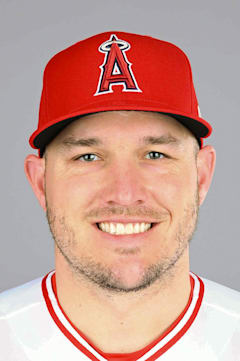
Mike Trout
The most remarkable thing about Trout's twilight isn't the decline — it's how gradual it's been. At 35, he's posting a career 132 OPS+, meaning he's been 32% better than league average over 15 seasons. That peak 150 OPS+ in 2018 represents the ceiling of what many consider the game's most complete player of the 2010s.
Three MVP awards and nine Silver Sluggers tell the story of sustained excellence, but the 404 career home runs might be his most impressive number. Trout reached that mark despite missing significant time to injuries in recent seasons, proving his power stroke remains elite even as his legs have betrayed him. The Angels never built around him properly, but individual brilliance like this transcends team context.
| Date | AB | H | HR | RBI | BB | SO | AVG |
|---|---|---|---|---|---|---|---|
| Jul 18 | 3 | 1 | 0 | 0 | 1 | 2 | .238 |
| Jul 17 | 4 | 1 | 0 | 0 | 0 | 2 | .237 |
| Jul 14 | 3 | 0 | 0 | 0 | 0 | 1 | .000 |
| Jul 12 | 4 | 2 | 0 | 0 | 0 | 0 | .237 |
| Jul 11 | 5 | 2 | 0 | 0 | 0 | 1 | .233 |
| Jul 9 | 5 | 0 | 0 | 1 | 0 | 2 | .230 |
| Jul 8 | 4 | 1 | 1 | 2 | 1 | 1 | .234 |
| Jun 17 | 3 | 1 | 0 | 0 | 1 | 0 | .234 |
| Jun 16 | 5 | 2 | 1 | 3 | 0 | 2 | .233 |
| Jun 15 | 3 | 2 | 1 | 1 | 0 | 1 | .230 |
Career · Batting
16 seasons| Year | Team | G | AB | HR | RBI | AVG | OPS | OPS+ |
|---|---|---|---|---|---|---|---|---|
| 2011 | — | 40 | 123 | 5 | 16 | — | — | — |
| 2012 | — | 139 | 559 | 30 | 83 | — | — | — |
| 2013 | — | 157 | 589 | 27 | 97 | — | — | — |
| 2014 | — | 157 | 602 | 36 | 111 | — | — | — |
| 2015 | — | 159 | 575 | 41 | 90 | — | — | — |
| 2016 | — | 159 | 549 | 29 | 100 | — | — | — |
| 2017 | — | 114 | 402 | 33 | 72 | — | 1.071 | — |
| 2018 | — | 140 | 471 | 39 | 79 | — | 1.088 | — |
| 2019 | — | 134 | 470 | 45 | 104 | — | 1.083 | — |
| 2020 | — | 53 | 199 | 17 | 46 | — | — | — |
| 2021 | — | 36 | 117 | 8 | 18 | — | 1.090 | — |
| 2022 | — | 119 | 438 | 40 | 80 | — | — | — |
| 2023 | — | 82 | 308 | 18 | 44 | — | — | — |
| 2024 | — | 29 | 109 | 10 | 14 | — | — | — |
| 2025 | — | 130 | 456 | 26 | 64 | — | — | — |
| 2026 | — | 80 | 290 | 18 | 39 | — | — | — |
| Career | 1728 | 6257 | 422 | 1057 | — | — | — | |
Every ball this hitter has put in play — how hard it left the bat, and at what angle. The red field behind the dots shows how much damage that kind of contact does, league-wide: the darker the red, the better things go for the hitter.
The field — league-average xwOBA (what a batted ball is typically worth: 0.0 is a sure out, ~2.0 a sure home run) for every exit-velocity × launch-angle combination, measured from 1.3 million regular-season balls in play since 2015. The dark ridge — balls hit 105+ mph at 25–30° — is the barrel zone, where contact becomes near-automatic extra bases.
The dots — this hitter’s career regular-season balls in play, grouped to a fine grid; a bigger dot means more batted balls at that exact combination. Dots piled onto the red ridge are damage; dots low on the pale field are weak or mishit contact. Spring training and the postseason are excluded.
Matchups, projections, comps — grounded in Lahman, Retrosheet, and Statcast.