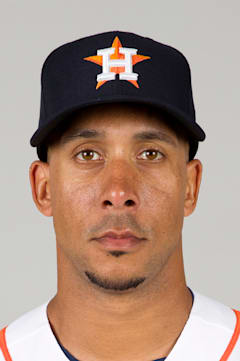
Michael Brantley
The quiet excellence of Brantley's career gets lost in baseball's noise, but his .298 average across 15 seasons tells the story of pure contact hitting in an era that forgot the skill existed. While teammates swung for the fences, he perfected the art of finding gaps and moving runners.
That 2014 campaign stands as his masterpiece — a .327 average with 20 homers that should have earned more MVP consideration than it received. His OPS+ of 127 that year represented the peak of a player who made consistency his calling card, never posting a full-season average below .284 in Cleveland.
Five All-Star selections reward a player who understood his role perfectly. The Silver Slugger validates what scouts always knew: Brantley could hit anybody's fastball and lay off anybody's breaking ball. His 105 career OPS+ won't dazzle, but it represents 15 years of professional at-bats when others were striking out.
Career · Batting
15 seasons| Year | Team | G | AB | HR | RBI | AVG | OPS | OPS+ |
|---|---|---|---|---|---|---|---|---|
| 2009 | CLE | 28 | 112 | 0 | 11 | .313 | .707 | 94 |
| 2010 | CLE | 72 | 297 | 3 | 22 | .246 | .623 | 86 |
| 2011 | CLE | 114 | 451 | 7 | 46 | .266 | .702 | 98 |
| 2012 | CLE | 149 | 552 | 6 | 60 | .288 | .750 | 104 |
| 2013 | CLE | 151 | 556 | 10 | 73 | .284 | .728 | 102 |
| 2014 | CLE | 156 | 611 | 20 | 97 | .327 | .890 | 127 |
| 2015 | CLE | 137 | 529 | 15 | 84 | .310 | .859 | 119 |
| 2016 | CLE | 11 | 39 | 0 | 7 | .231 | .561 | 76 |
| 2017 | CLE | 90 | 338 | 9 | 52 | .299 | .801 | 107 |
| 2018 | CLE | 143 | 570 | 17 | 76 | .309 | .832 | 114 |
| 2019 | HOU | 148 | 575 | 22 | 90 | .311 | .875 | 116 |
| 2020 | HOU | 46 | 170 | 5 | 22 | .300 | .840 | 114 |
| 2021 | HOU | 121 | 469 | 8 | 47 | .311 | .799 | 110 |
| 2022 | HOU | 64 | 243 | 5 | 26 | .288 | .785 | 111 |
| 2023 | HOU | 15 | 54 | 2 | 7 | .278 | .724 | 99 |
| Career | 1445 | 5566 | 129 | 720 | .298 | — | — | |
Every ball this hitter has put in play — how hard it left the bat, and at what angle. The red field behind the dots shows how much damage that kind of contact does, league-wide: the darker the red, the better things go for the hitter.
The field — league-average xwOBA (what a batted ball is typically worth: 0.0 is a sure out, ~2.0 a sure home run) for every exit-velocity × launch-angle combination, measured from 1.3 million regular-season balls in play since 2015. The dark ridge — balls hit 105+ mph at 25–30° — is the barrel zone, where contact becomes near-automatic extra bases.
The dots — this hitter’s career regular-season balls in play, grouped to a fine grid; a bigger dot means more batted balls at that exact combination. Dots piled onto the red ridge are damage; dots low on the pale field are weak or mishit contact. Spring training and the postseason are excluded.
Matchups, projections, comps — grounded in Lahman, Retrosheet, and Statcast.