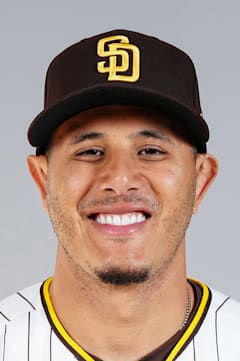
Manny Machado
Machado's best baseball might be behind him, but he's aging more gracefully than most third basemen. That .279 career average tells only half the story — his plate discipline has quietly improved in recent years, walking more and striking out less than during his Baltimore days.
The defensive metrics paint a complicated picture. Those two Gold Gloves came early in his career, and while his range has diminished, his arm strength remains elite. He's evolved into more of a steady presence than a spectacular one at the hot corner.
Seven All-Star selections and 369 home runs represent solid Hall of Fame credentials, though he'll need a few more productive seasons to cement his case. His 2020 breakout in San Diego showed he could still reach peak form when healthy and motivated.
| Date | AB | H | HR | RBI | BB | SO | AVG |
|---|---|---|---|---|---|---|---|
| Jul 18 | 3 | 0 | 0 | 0 | 1 | 1 | .199 |
| Jul 17 | 4 | 0 | 0 | 0 | 1 | 0 | .201 |
| Jul 12 | 4 | 3 | 0 | 1 | 0 | 0 | .203 |
| Jul 11 | 5 | 1 | 0 | 2 | 0 | 1 | .196 |
| Jul 10 | 4 | 2 | 0 | 0 | 0 | 1 | .196 |
| Jul 9 | 3 | 2 | 1 | 1 | 0 | 0 | .193 |
| Jul 7 | 3 | 0 | 0 | 0 | 1 | 2 | .188 |
| Jul 6 | 4 | 1 | 0 | 0 | 0 | 1 | .190 |
| Jul 5 | 2 | 1 | 1 | 3 | 3 | 0 | .189 |
| Jul 4 | 4 | 0 | 0 | 0 | 0 | 3 | .187 |
Career · Batting
17 seasons| Year | Team | G | AB | HR | RBI | AVG | OPS | OPS+ |
|---|---|---|---|---|---|---|---|---|
| 2012 | — | 51 | 191 | 7 | 26 | — | — | — |
| 2013 | — | 156 | 667 | 14 | 71 | — | — | — |
| 2014 | — | 82 | 327 | 12 | 32 | — | — | — |
| 2015 | — | 162 | 633 | 35 | 86 | — | — | — |
| 2016 | — | 157 | 640 | 37 | 96 | — | — | — |
| 2017 | — | 156 | 630 | 33 | 95 | — | — | — |
| 2018 | — | 96 | 365 | 24 | 65 | — | — | — |
| 2018 | — | 66 | 267 | 13 | 42 | — | — | — |
| 2018 | — | 162 | 632 | 37 | 107 | — | — | — |
| 2019 | — | 156 | 587 | 32 | 85 | — | — | — |
| 2020 | — | 60 | 224 | 16 | 47 | — | — | — |
| 2021 | — | 153 | 564 | 28 | 106 | — | — | — |
| 2022 | — | 150 | 578 | 32 | 102 | — | — | — |
| 2023 | — | 138 | 543 | 30 | 91 | — | — | — |
| 2024 | — | 152 | 593 | 29 | 105 | — | — | — |
| 2025 | — | 159 | 615 | 27 | 95 | — | — | — |
| 2026 | — | 95 | 347 | 19 | 55 | — | — | — |
| Career | 2151 | 8403 | 425 | 1306 | — | — | — | |
Every ball this hitter has put in play — how hard it left the bat, and at what angle. The red field behind the dots shows how much damage that kind of contact does, league-wide: the darker the red, the better things go for the hitter.
The field — league-average xwOBA (what a batted ball is typically worth: 0.0 is a sure out, ~2.0 a sure home run) for every exit-velocity × launch-angle combination, measured from 1.3 million regular-season balls in play since 2015. The dark ridge — balls hit 105+ mph at 25–30° — is the barrel zone, where contact becomes near-automatic extra bases.
The dots — this hitter’s career regular-season balls in play, grouped to a fine grid; a bigger dot means more batted balls at that exact combination. Dots piled onto the red ridge are damage; dots low on the pale field are weak or mishit contact. Spring training and the postseason are excluded.
Matchups, projections, comps — grounded in Lahman, Retrosheet, and Statcast.