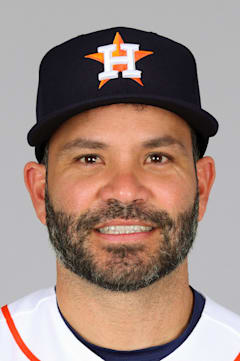
Jose Altuve
The little engine that could is running out of steam. Altuve's 2025 campaign at age 36 represents a crossroads for the Astros' franchise cornerstone, whose 5-foot-6 frame has defied baseball convention for over a decade. His career .303 average and 255 home runs tell the story of one of the most unlikely superstars in modern baseball history.
That 2022 season stands as his masterpiece — a .921 OPS at age 32 when most second basemen are declining. The 28 homers matched his career high, proving his diminutive stature never limited his power ceiling. Seven Silver Sluggers speak to sustained offensive excellence that few middle infielders have matched.
The question now is whether those quick hands and elite contact skills can mask the inevitable erosion of his athleticism. His MVP trophy and Gold Glove anchor a Hall of Fame résumé, but Father Time remains undefeated.
| Date | AB | H | HR | RBI | BB | SO | AVG |
|---|---|---|---|---|---|---|---|
| Jul 12 | 4 | 1 | 1 | 1 | 0 | 2 | .235 |
| Jul 11 | 4 | 1 | 0 | 0 | 0 | 0 | .235 |
| Jul 10 | 4 | 2 | 0 | 0 | 0 | 1 | .235 |
| Jul 8 | 4 | 0 | 0 | 0 | 0 | 2 | .231 |
| Jul 7 | 5 | 1 | 1 | 1 | 0 | 1 | .234 |
| Jul 6 | 5 | 1 | 1 | 3 | 0 | 1 | .235 |
| Jul 5 | 3 | 1 | 0 | 0 | 1 | 1 | .236 |
| Jul 4 | 3 | 2 | 0 | 0 | 2 | 0 | .234 |
| Jul 3 | 4 | 0 | 0 | 0 | 0 | 2 | .229 |
| Jul 1 | 4 | 1 | 0 | 0 | 1 | 1 | .233 |
Career · Batting
16 seasons| Year | Team | G | AB | HR | RBI | AVG | OPS | OPS+ |
|---|---|---|---|---|---|---|---|---|
| 2011 | — | 57 | 221 | 2 | 12 | — | — | — |
| 2012 | — | 147 | 576 | 7 | 37 | — | — | — |
| 2013 | — | 152 | 626 | 5 | 52 | — | — | — |
| 2014 | — | 158 | 660 | 7 | 59 | — | — | — |
| 2015 | — | 154 | 638 | 15 | 66 | — | — | — |
| 2016 | — | 161 | 640 | 24 | 96 | — | — | — |
| 2017 | — | 153 | 590 | 24 | 81 | — | — | — |
| 2018 | — | 137 | 534 | 13 | 61 | — | — | — |
| 2019 | — | 124 | 500 | 31 | 74 | — | — | — |
| 2020 | — | 48 | 192 | 5 | 18 | — | — | — |
| 2021 | — | 146 | 601 | 31 | 83 | — | — | — |
| 2022 | — | 141 | 527 | 28 | 57 | — | — | — |
| 2023 | — | 90 | 360 | 17 | 51 | — | — | — |
| 2024 | — | 153 | 628 | 20 | 65 | — | — | — |
| 2025 | — | 155 | 588 | 26 | 77 | — | — | — |
| 2026 | — | 75 | 288 | 11 | 27 | — | — | — |
| Career | 2051 | 8169 | 266 | 916 | — | — | — | |
Every ball this hitter has put in play — how hard it left the bat, and at what angle. The red field behind the dots shows how much damage that kind of contact does, league-wide: the darker the red, the better things go for the hitter.
The field — league-average xwOBA (what a batted ball is typically worth: 0.0 is a sure out, ~2.0 a sure home run) for every exit-velocity × launch-angle combination, measured from 1.3 million regular-season balls in play since 2015. The dark ridge — balls hit 105+ mph at 25–30° — is the barrel zone, where contact becomes near-automatic extra bases.
The dots — this hitter’s career regular-season balls in play, grouped to a fine grid; a bigger dot means more batted balls at that exact combination. Dots piled onto the red ridge are damage; dots low on the pale field are weak or mishit contact. Spring training and the postseason are excluded.
Matchups, projections, comps — grounded in Lahman, Retrosheet, and Statcast.