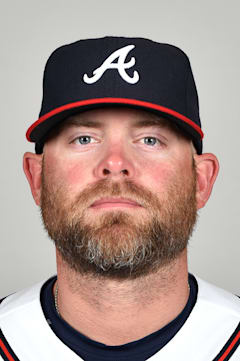
Brian McCann
McCann's 2006 breakout season remains one of the most dominant catching campaigns of the modern era. At just 22, he posted a .333 average with 24 homers — offensive numbers that would make any catcher a perennial MVP candidate today, when the position has become offensively barren.
What made McCann special wasn't just the peak performance but the sustained excellence. Six Silver Sluggers tell the story of a catcher who consistently outproduced his peers at baseball's most demanding position. His 282 career home runs rank among the highest totals for catchers in the expansion era.
The OPS+ of 106 across 15 seasons understates his value — catching offense has declined significantly since McCann's prime. He was the rare backstop who could anchor a lineup's middle while handling the rigors behind the plate year after year.
Career · Batting
15 seasons| Year | Team | G | AB | HR | RBI | AVG | OPS | OPS+ |
|---|---|---|---|---|---|---|---|---|
| 2005 | ATL | 59 | 180 | 5 | 23 | .278 | .745 | 99 |
| 2006 | ATL | 130 | 442 | 24 | 93 | .333 | .961 | 125 |
| 2007 | ATL | 139 | 504 | 18 | 92 | .270 | .772 | 102 |
| 2008 | ATL | 145 | 509 | 23 | 87 | .301 | .896 | 120 |
| 2009 | ATL | 138 | 488 | 21 | 94 | .281 | .834 | 111 |
| 2010 | ATL | 143 | 479 | 21 | 77 | .269 | .828 | 114 |
| 2011 | ATL | 128 | 466 | 24 | 71 | .270 | .817 | 114 |
| 2012 | ATL | 121 | 439 | 20 | 67 | .230 | .698 | 96 |
| 2013 | ATL | 102 | 356 | 20 | 57 | .256 | .796 | 111 |
| 2014 | NYY | 140 | 495 | 23 | 75 | .232 | .692 | 99 |
| 2015 | NYY | 135 | 465 | 26 | 94 | .232 | .756 | 105 |
| 2016 | NYY | 130 | 429 | 20 | 58 | .242 | .748 | 101 |
| 2017 | HOU | 97 | 349 | 18 | 62 | .241 | .759 | 101 |
| 2018 | HOU | 63 | 189 | 7 | 23 | .212 | .640 | 88 |
| 2019 | ATL | 85 | 277 | 12 | 45 | .249 | .734 | 97 |
| Career | 1755 | 6067 | 282 | 1018 | .262 | — | — | |
Every ball this hitter has put in play — how hard it left the bat, and at what angle. The red field behind the dots shows how much damage that kind of contact does, league-wide: the darker the red, the better things go for the hitter.
The field — league-average xwOBA (what a batted ball is typically worth: 0.0 is a sure out, ~2.0 a sure home run) for every exit-velocity × launch-angle combination, measured from 1.3 million regular-season balls in play since 2015. The dark ridge — balls hit 105+ mph at 25–30° — is the barrel zone, where contact becomes near-automatic extra bases.
The dots — this hitter’s career regular-season balls in play, grouped to a fine grid; a bigger dot means more batted balls at that exact combination. Dots piled onto the red ridge are damage; dots low on the pale field are weak or mishit contact. Spring training and the postseason are excluded.
Matchups, projections, comps — grounded in Lahman, Retrosheet, and Statcast.