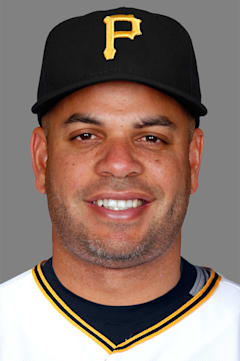
Aramis Ramirez
The most underrated third baseman of the 2000s quietly assembled one of the era's most consistent offensive records. Ramirez's 386 career home runs rank among the top dozen third basemen in baseball history, yet he never received serious MVP consideration despite multiple elite seasons.
His 2004 campaign stands as a masterpiece of sustained excellence — that .951 OPS represents a 25% improvement over league average, anchoring a Cubs lineup that finally showed promise. What made Ramirez special wasn't peak performance but remarkable durability and clutch timing, as evidenced by his 1,417 RBI over 18 seasons.
The Dominican slugger's career arc tells the story of smart, patient hitting. His OPS+ of 108 across nearly 2,200 games demonstrates the kind of above-average production that wins championships, even if it doesn't generate headlines. Three All-Star selections undersell a player who provided steady power from baseball's most demanding defensive position.
Career · Batting
18 seasons| Year | Team | G | AB | HR | RBI | AVG | OPS | OPS+ |
|---|---|---|---|---|---|---|---|---|
| 1998 | PIT | 72 | 251 | 6 | 24 | .235 | .646 | 86 |
| 1999 | PIT | 18 | 56 | 0 | 7 | .179 | .504 | 65 |
| 2000 | PIT | 73 | 254 | 6 | 35 | .256 | .695 | 89 |
| 2001 | PIT | 158 | 603 | 34 | 112 | .300 | .885 | 117 |
| 2002 | PIT | 142 | 522 | 18 | 71 | .234 | .666 | 89 |
| 2003 | PIT | 159 | 607 | 27 | 106 | .272 | .788 | 104 |
| 2004 | CHC | 145 | 547 | 36 | 103 | .318 | .951 | 125 |
| 2005 | CHC | 123 | 463 | 31 | 92 | .302 | .926 | 124 |
| 2006 | CHC | 157 | 594 | 38 | 119 | .291 | .912 | 119 |
| 2007 | CHC | 132 | 506 | 26 | 101 | .310 | .915 | 121 |
| 2008 | CHC | 149 | 554 | 27 | 111 | .289 | .898 | 120 |
| 2009 | CHC | 82 | 306 | 15 | 65 | .317 | .905 | 121 |
| 2010 | CHC | 124 | 465 | 25 | 83 | .241 | .745 | 102 |
| 2011 | CHC | 149 | 565 | 26 | 93 | .306 | .871 | 121 |
| 2012 | MIL | 149 | 570 | 27 | 105 | .300 | .901 | 124 |
| 2013 | MIL | 92 | 304 | 12 | 49 | .283 | .831 | 116 |
| 2014 | MIL | 133 | 494 | 15 | 66 | .285 | .757 | 108 |
| 2015 | MIL | 137 | 475 | 17 | 75 | .246 | .720 | 100 |
| Career | 2194 | 8136 | 386 | 1417 | .283 | — | — | |
Every ball this hitter has put in play — how hard it left the bat, and at what angle. The red field behind the dots shows how much damage that kind of contact does, league-wide: the darker the red, the better things go for the hitter.
The field — league-average xwOBA (what a batted ball is typically worth: 0.0 is a sure out, ~2.0 a sure home run) for every exit-velocity × launch-angle combination, measured from 1.3 million regular-season balls in play since 2015. The dark ridge — balls hit 105+ mph at 25–30° — is the barrel zone, where contact becomes near-automatic extra bases.
The dots — this hitter’s career regular-season balls in play, grouped to a fine grid; a bigger dot means more batted balls at that exact combination. Dots piled onto the red ridge are damage; dots low on the pale field are weak or mishit contact. Spring training and the postseason are excluded.
Matchups, projections, comps — grounded in Lahman, Retrosheet, and Statcast.