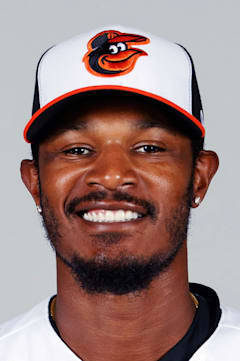
Adam Jones
Jones was the rare center fielder who could anchor a lineup while patrolling vast outfield acreage with Gold Glove precision. His 282 career home runs rank among the highest totals ever by a center fielder, while his four Gold Gloves speak to defensive excellence that defined Baltimore's identity through their competitive window.
The 2012 season captured Jones at his apex — 32 homers and an .839 OPS that was 16 percent above league average, his career high. That year epitomized his unique blend of power and defense that made him the cornerstone of those scrappy Orioles teams.
Five All-Star selections tell the story of sustained excellence, but Jones' true value showed in his durability and two-way impact. Few players have combined 280-plus home runs with elite center field defense, making him a franchise pillar during Baltimore's resurgence in the 2010s.
Career · Batting
14 seasons| Year | Team | G | AB | HR | RBI | AVG | OPS | OPS+ |
|---|---|---|---|---|---|---|---|---|
| 2006 | SEA | 32 | 74 | 1 | 8 | .216 | .548 | 71 |
| 2007 | SEA | 41 | 65 | 2 | 4 | .246 | .700 | 92 |
| 2008 | BAL | 132 | 477 | 9 | 57 | .270 | .711 | 95 |
| 2009 | BAL | 119 | 473 | 19 | 70 | .277 | .792 | 106 |
| 2010 | BAL | 149 | 581 | 19 | 69 | .284 | .767 | 105 |
| 2011 | BAL | 151 | 567 | 25 | 83 | .280 | .785 | 109 |
| 2012 | BAL | 162 | 648 | 32 | 82 | .287 | .839 | 116 |
| 2013 | BAL | 160 | 653 | 33 | 108 | .285 | .811 | 114 |
| 2014 | BAL | 159 | 644 | 29 | 96 | .281 | .780 | 111 |
| 2015 | BAL | 137 | 546 | 27 | 82 | .269 | .782 | 108 |
| 2016 | BAL | 152 | 619 | 29 | 83 | .265 | .746 | 101 |
| 2017 | BAL | 147 | 597 | 26 | 73 | .285 | .787 | 105 |
| 2018 | BAL | 145 | 580 | 15 | 63 | .281 | .732 | 101 |
| 2019 | AZ | 137 | 485 | 16 | 67 | .260 | .728 | 96 |
| Career | 1823 | 7009 | 282 | 945 | .277 | — | — | |
Every ball this hitter has put in play — how hard it left the bat, and at what angle. The red field behind the dots shows how much damage that kind of contact does, league-wide: the darker the red, the better things go for the hitter.
The field — league-average xwOBA (what a batted ball is typically worth: 0.0 is a sure out, ~2.0 a sure home run) for every exit-velocity × launch-angle combination, measured from 1.3 million regular-season balls in play since 2015. The dark ridge — balls hit 105+ mph at 25–30° — is the barrel zone, where contact becomes near-automatic extra bases.
The dots — this hitter’s career regular-season balls in play, grouped to a fine grid; a bigger dot means more batted balls at that exact combination. Dots piled onto the red ridge are damage; dots low on the pale field are weak or mishit contact. Spring training and the postseason are excluded.
Matchups, projections, comps — grounded in Lahman, Retrosheet, and Statcast.